For many years, traders and analysts have used price charts and graphs to get an idea of the stock market and the behavior of major traders and trading institutions.
In those times, price charts and graphs consisted of lines and bars. These charts were also known as candlesticks. However, nowadays, traders and analysts use the stock market heat map chart to analyze the market.
In this article, you will basically learn about the stock market heat map and how to use it for your benefit. Apart from that, I will provide you with some of the major benefits of the heat map, which can help you by giving you better trading data.
This shall result in profitable trading in your case. Hence, to learn how to use the heat map stock market chart read on through to the end of the article.
Contents
Stock Market Heat Map: What Does It Do?
The stock market heat map helps you to get a better idea of the market and find out where the liquidity actually is. Apart from that, you will also have a better understanding of the behavior patterns of the liquidity providers in the market.
In earlier times, you could not get information from the public about limit orders. However, today, the information is available on the internet. Furthermore, the price of stocks depends upon such types of orders. Hence, in such a case, the heat map helps in charting the financial assets.
Basically, the heat map allows traders to find out where other notable traders are making orders in the market. You can also find stock market heat maps live on many stock market platforms on the internet. According to an article on BookMap.com,
“It provides a better method of charting financial assets – better because it charts the actual determinants of price, the orders themselves, instead of their consequence.”
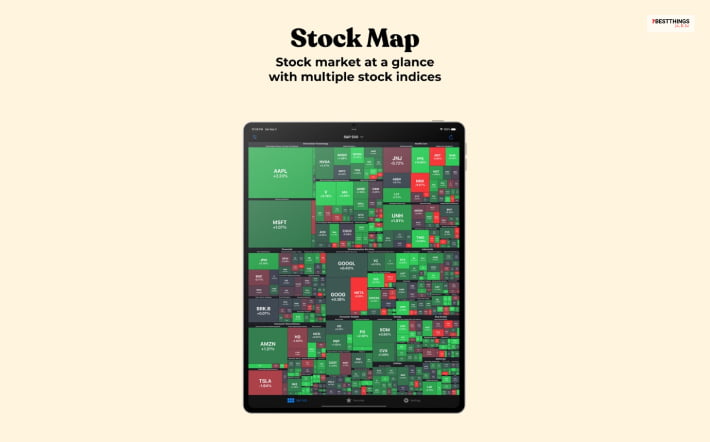
The Heat Map consists of a visual representation of the limit orders that are put into the order book. Once you check a stock market heat map online, you will find out a vertical scale and a horizontal scale.
The right side of the vertical timeline shows the current order book, while on the left side of the vertical timeline, the earlier position of the order book is given. However, the position of the data might change based on which platform you are using.
Stock Market Heat Map Real Time: Why Is It A Better Option?
As per the claims made by Investopedia,
“Heatmaps are helpful because they can provide an efficient and comprehensive overview of a topic at-a-glance. Unlike charts or tables, which have to be interpreted or studied to be understood, heatmaps are direct data visualization tools that are more self-explanatory and easy to read.”
One of the biggest advantages of using a heat map in place of traditional charts is that heat maps come with all types of data related to the situation of the stock market.
The following are the major factors associated with a heat map that makes it a great option for predicting the situation of the stock market:

- Different factors in the stock market are represented on the heat map with the help of different colors.
- You can get better access to statistical information that is based on real-time data, which you can disseminate easily.
- You can get more information about the participation of users on a website.
- The stock market heat map became in trend and got popular after the recession period in 2008.
You can see here that heat maps are extremely helpful for traders as they provide an effective as well as detailed and pictorial overview of the topic you are looking for.
It is slightly different from a chart or table, which you need to interpret and study. On the contrary, heat maps provide you with a direct visualization of the data, which is easy to read and self-explanatory at the same time.
How Can You Do Profitable Trading With The Heat Map?
You have to understand that the heat map does not consist of a system of trading, and it is not an indicator of the status of stocks either.
You will just get accurate information about the situation of the market participants. Hence, using a proper heat map, you will be able to eliminate the problem of inaccurate information.
Using the heat map, you will thus be able to interpret the situation of the market in a better manner. According to LiberatedStockTrader
“The heat map’s easily digestible format enables traders to quickly understand big data helping them make faster and more informed investing decisions. Heat maps can prove invaluable in understanding complex market behavior with ease and helping investors make smarter decisions.”
However, in some cases, heat maps can be quite misleading since there are large amounts of data, and a reader can miss out on some of the necessary information. This can lead to inaccuracies in assumptions about the trend the treader is looking for.
Here, citing the problems, Investopedia.com points out –
“Heatmaps can show that certain situations happened but do not provide insight into why the situation occurred, what factors were involved in the situation happening, or what the forecast for the future will be.”
Despite all its limitations, a heat map has been a popular tool among traders in the last decade. This is helpful if you want to visualize huge sets of data in real-time.
Unlike traditional graphs and charts, the format of the heat map is more visual and understandable. This will help you not just in making an informed decision, but you will be able to decide faster.

Final Thoughts
Hope this article was helpful for you in getting a better idea of how to stock market heat map and how it works. If you are tired of looking at dull candlestick charts and graphs, then you must look at various heat maps available on the internet. You will thus get access to a lot of data in one place.
What do you think of the usefulness of the heat map in trading? Share your views in the comments section below.
Also read: